Filtering the data shown in tables
Risk graphs and/or advanced filters are available on some pages to help you filter the information shown in tables.
Risk Graphs
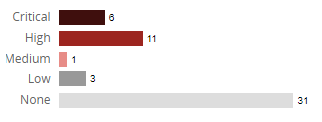
Some pages display risk graphs which indicate the number of items in the table shown below the graphs that have that security, license, and/or operational risk at that severity level.
For security risk:

For license and operational risk:

-
Critical risk: 50% black and 50% red (security risk only)
-
High risk: 100% red
-
Medium risk: 50% red
-
Low risk: 100% gray
-
None: 50% gray
Select a severity label/graph to filter the table to show only those items that have a specific type and severity of risk.
Advanced Filters
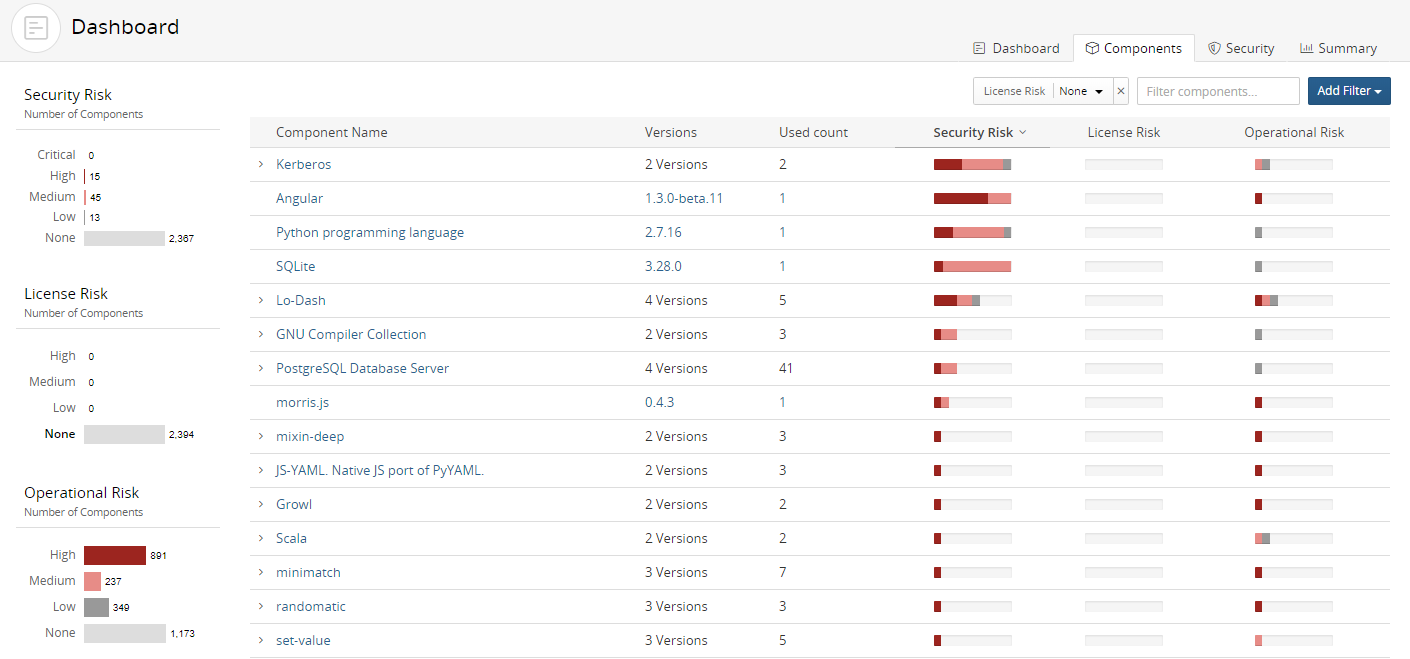
On some pages, tables have an advanced filter feature that provides an easy way to view the data. This feature provides you with a clear view of the filters that are being applied to the table.
To use advanced filters:
-
Click
 to view the filters
for this table.
 -
Select a filter. The filter you selected appears at the top of the table.

-
Select values for this filter and click OK. If you select more than one value, Black Duck displays items that match either value.
-
Optionally, select additional filters. If you select more than one type of filter, Black Duck displays items that match all filters.
-
Black Duck displays items that match all selected filters. For example:

-
Click X to remove a filter.
